Nordic Sails Logo
Nordic Sails

RainVerify

RainVerify is a specialized application that gathers and formats NOAA precipitation data for pasture rangeland and forage insurance agents and policy holders, providing critical insights for agricultural insurance decisions.

Key Features

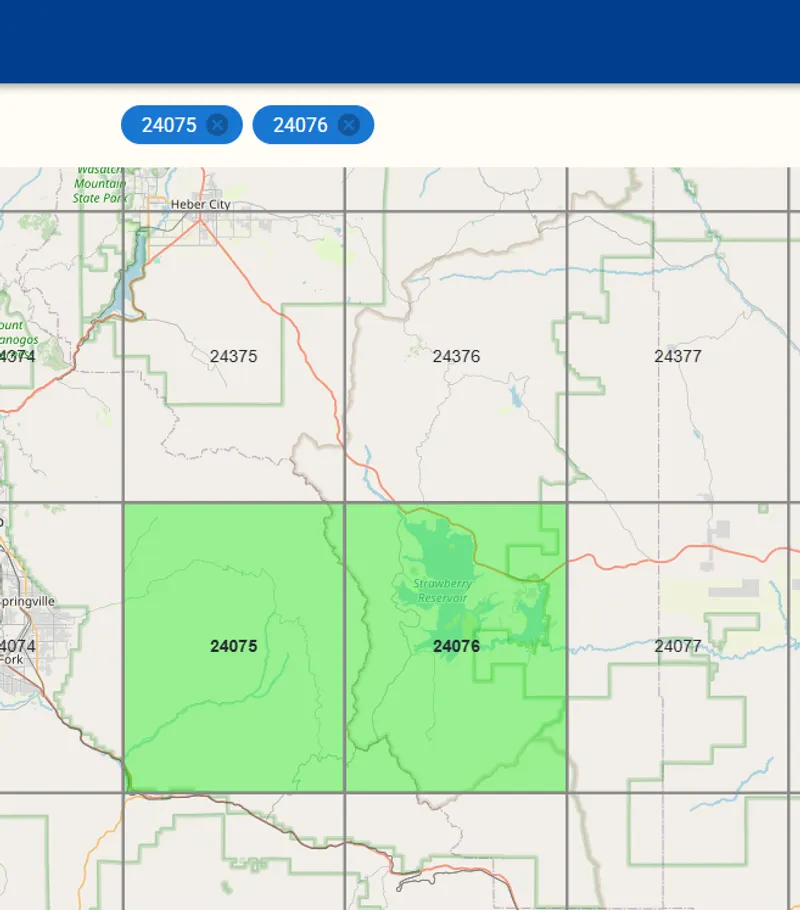
Grid-Based Data Analysis

Look up precipitation data by specific grid locations, allowing precise analysis of rainfall patterns for your exact land area.

Visual Data Representation

View precipitation data in both graphical and tabular formats, making it easy to understand rainfall patterns and trends over time.

Multi-Grid Comparison

Compare up to six different grid locations side by side, providing valuable insights for insurance policy decision-making.

Advanced Mapping

Utilize our interactive map with multiple search options, including GridID, street address, or device GPS location.

Core Features

Rain Verify Home Page

RainVerify dashboard interface

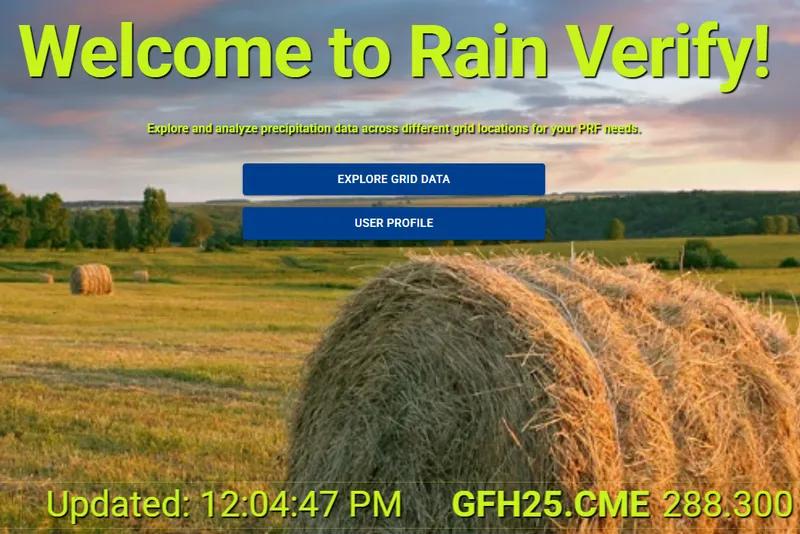
From the home page access all our features quickly:

Find your land and grid/s by navigating to the Grid Explorer
Check out market conditions by clicking the market ticker or Markets button
Go directly to your profile page to get signed in or become a member
Check out the About page to learn more about the service

Interactive Grid Map

RainVerify interactive grid map
RainVerify selected grids view

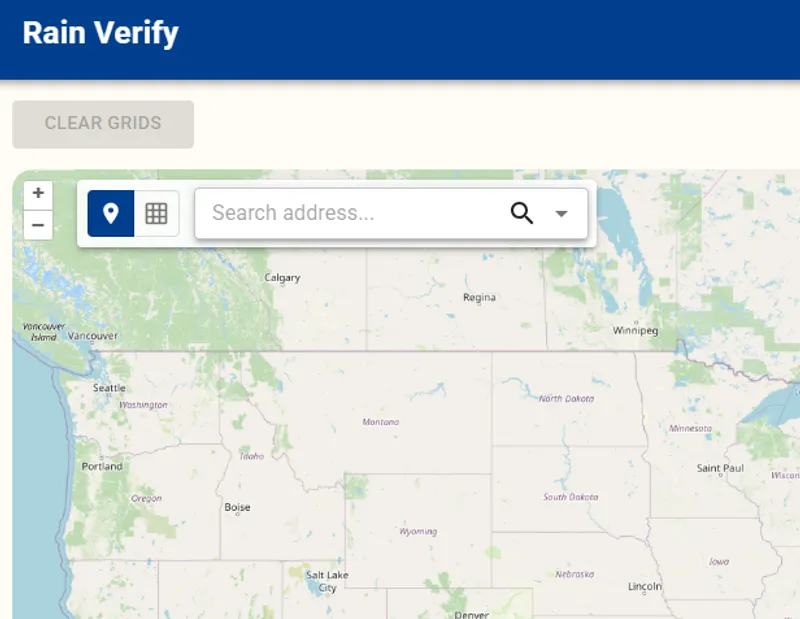
Our advanced mapping system offers multiple ways to locate your grid:

Search by GridID for precise location identification
Find your land using street address search
Use device GPS for instant location detection on mobile or desktop
Toggle between different map layers including grid overlays and Forest Service boundaries
Mobile-responsive design for fieldwork accessibility

Grid Groups

RainVerify grid groups

Grouping for convenience and speed:

Group Grids and assign a name
Easily access the grids you want fast
Navigate directly to the map with grids selected automatically
Edit any time you want

Data Visualization

RainVerify data visualization interface
Rainfall Predictions

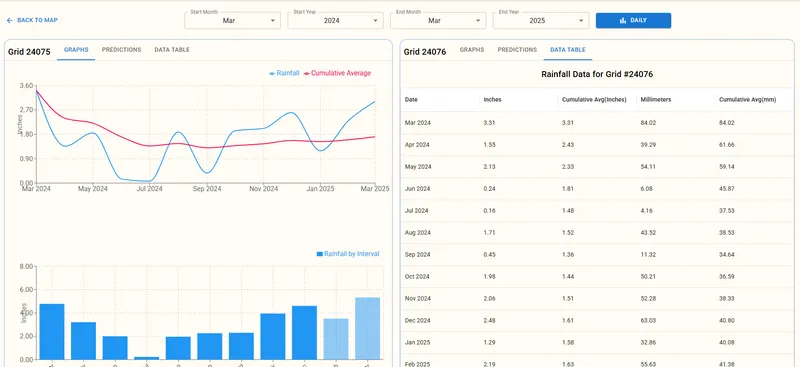
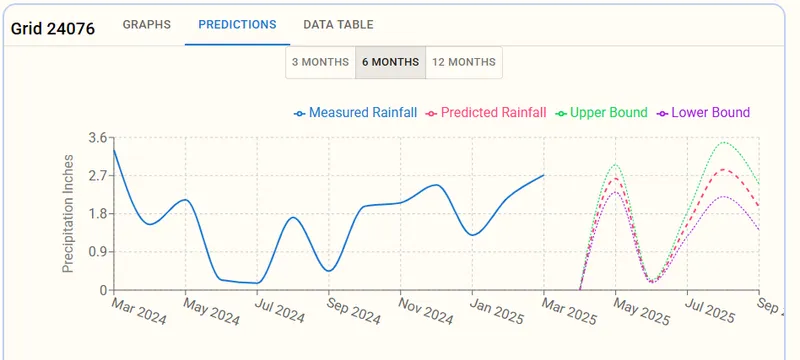
Comprehensive data visualization tools help you understand precipitation patterns:
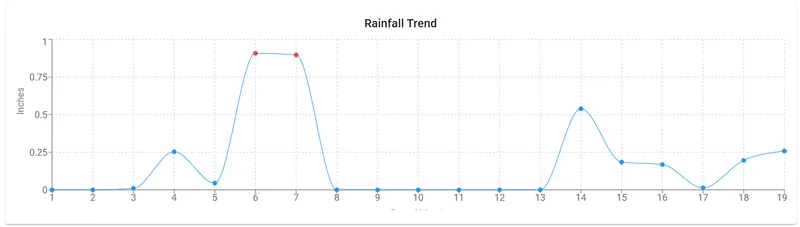
View data in both graphical and tabular formats
Analyze rainfall trends over customizable time periods
Access insurance policy interval values for accurate coverage assessment
Export data for external analysis or reporting

Daily Rain

RainVerify grid comparison feature

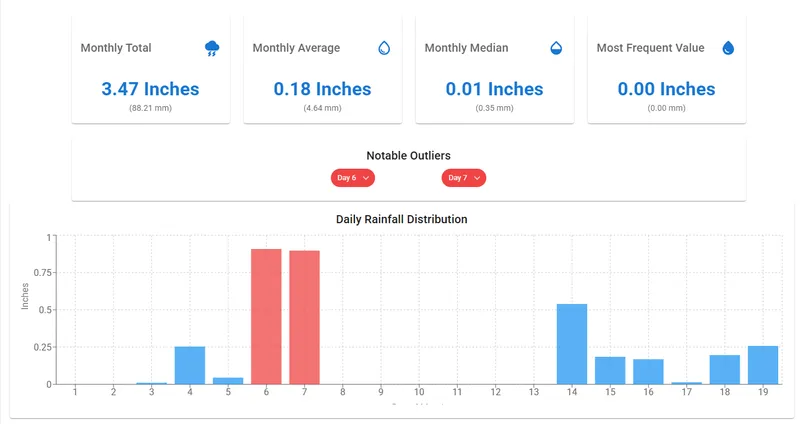
become a basic member to get access to Daily:

Multiple visual displays of data to best suit your needs
Most up to date data directly from NOAA
See which days were outliers for the Month
Know right away which days have the biggest impact on your policy
We save the data you have looked at for quicker access in the future

Premium Features

RainVerify premium features

Premium subscription unlocks additional powerful features:

Access to daily precipitation data for real-time monitoring
Create and save custom grid groups for quick access to frequently analyzed locations
One-click 'View in Map' feature for instant grid visualization
Track current policy performance with up-to-date precipitation measurements
Historical daily data access for comprehensive pattern analysis

Perfect For

RainVerify is designed specifically for:

Ideal for:

Pasture Rangeland and Forage (PRF) insurance agents and policyholders
Annual Forage program participants
Any agricultural insurance based on NOAA CONUS gauge-based gridded precipitation data
Ranchers and farmers making critical decisions based on precipitation patterns
Agricultural consultants providing data-driven recommendations

Ready to Get Started?

Visit RainVerify today and take control of your agricultural insurance data needs.

Visit RainVerify